
Deriving Multi Dimensional Gradient Vector Fields From Standardized Performance Signals
Standardized performance signals yield multi dimensional gradient fields by computing partial derivatives of operational effort across orthogonal value axes.
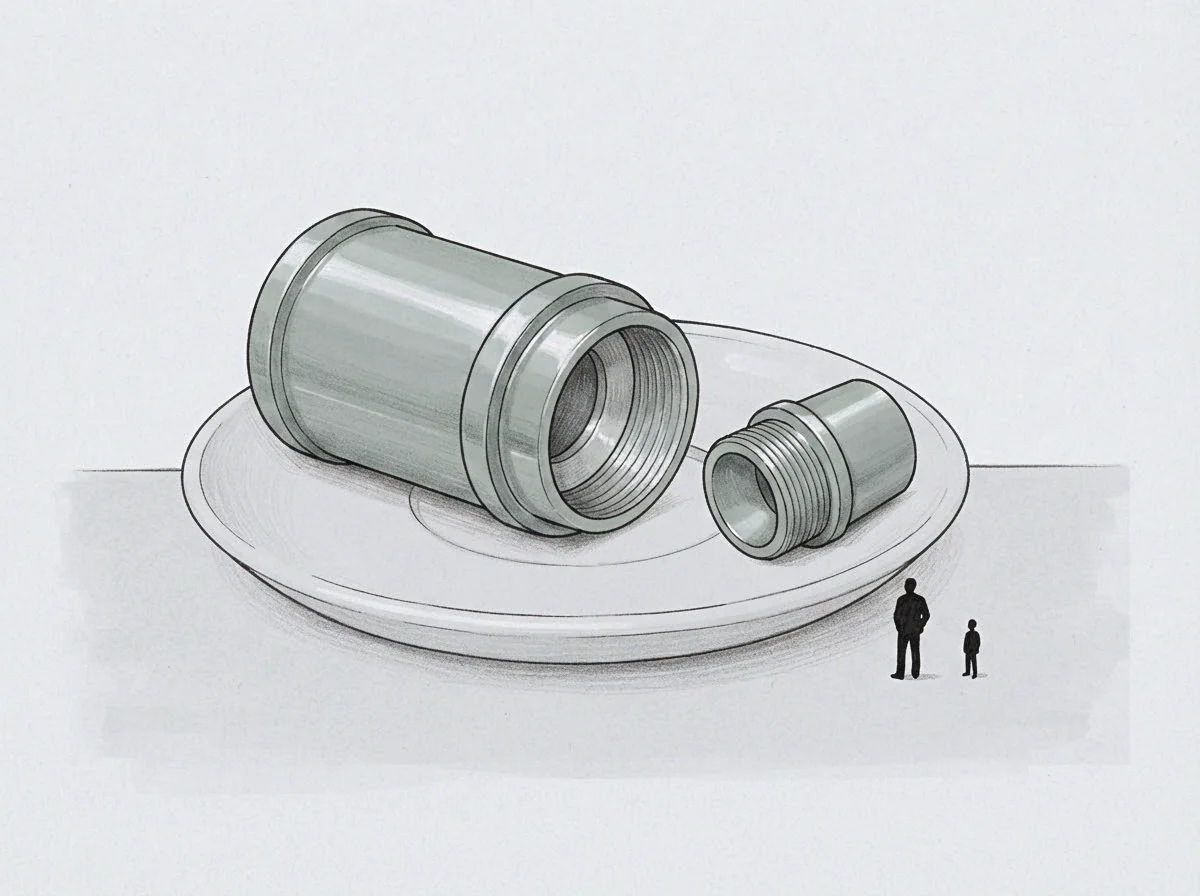
Signal
The quarterly revenue scalar arrives on schedule, showing seven percent growth while the engineering backlog sits unread for forty days. Executive dashboards aggregate thousands of discrete operational actions into single numbers. This creates a clean baseline for financial reporting, but it obscures the internal movements behind the result.
A scalar metric records magnitude without orientation, leaving it unclear whether progress comes from structural improvement or temporary exhaustion of reserves.
Deconstructing standardized performance indicators requires treating operational data as continuous scalar fields mapped across orthogonal axes. When performance signals enter reporting systems, they undergo scalar reduction, collapsing high-dimensional engineering, customer operations, and product development efforts into univariate figures. To recover spatial resolution where scalar reporting obscures internal vectors, analysts compute partial derivatives of system outputs relative to key resource inputs.

Deconstructing Standard Outputs into Field Coordinates
Reporting packages routinely compress operational trade-offs into single numerical summaries. A customer satisfaction metric of four point five out of five conceals severe procedural compromises made during implementation. With value as the underlying axis, concentrating effort on short-term target retention causes long-term infrastructure health to degrade at a measurable rate.
Calculating partial change across independent business functions extracts spatial movement from stagnant aggregate numbers. By measuring how output indicators vary when specific inputs shift, an organization constructs a coordinate map of operational performance, where each point represents a vector carrying both direction and magnitude.
When standard scalar indicators remain constant across consecutive reporting periods, directional derivatives along secondary axes isolate hidden operational friction.
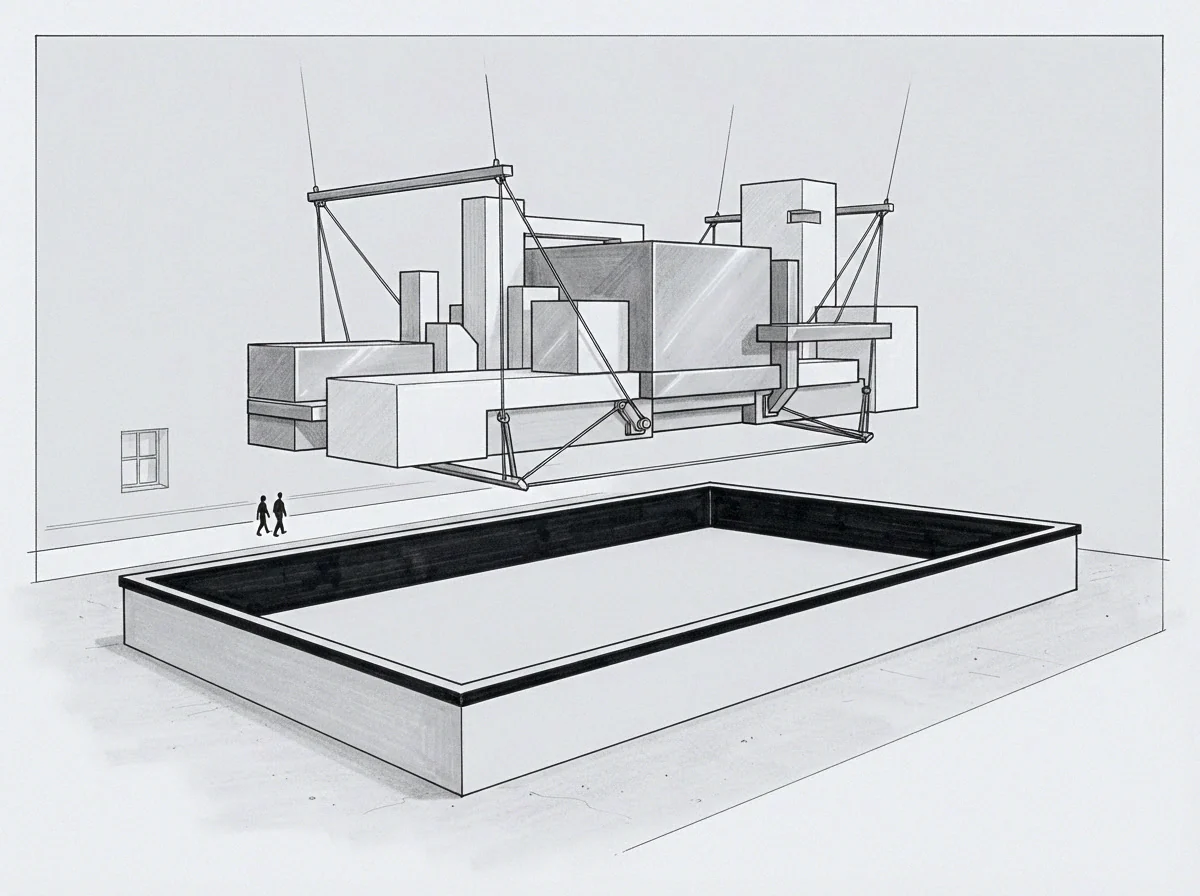
Evaluating Directional Derivatives Along Operational Vectors
Deriving vector fields begins by identifying orthogonal value axes across organizational workflows. Standardized signals supply raw scalar readings like deployment velocity, support resolution time, and customer churn. Evaluating these signals over time windows yields directional gradients that point toward rapid value generation or systemic decay.
When friction alters operational direction and a team encounters steep technical resistance along one axis, their output vectors rotate toward paths with lower immediate resistance. The resulting spatial field maps organizational movement across the operational terrain. When standard reports hide this friction, operational capacity degrades along the unmeasured axis.
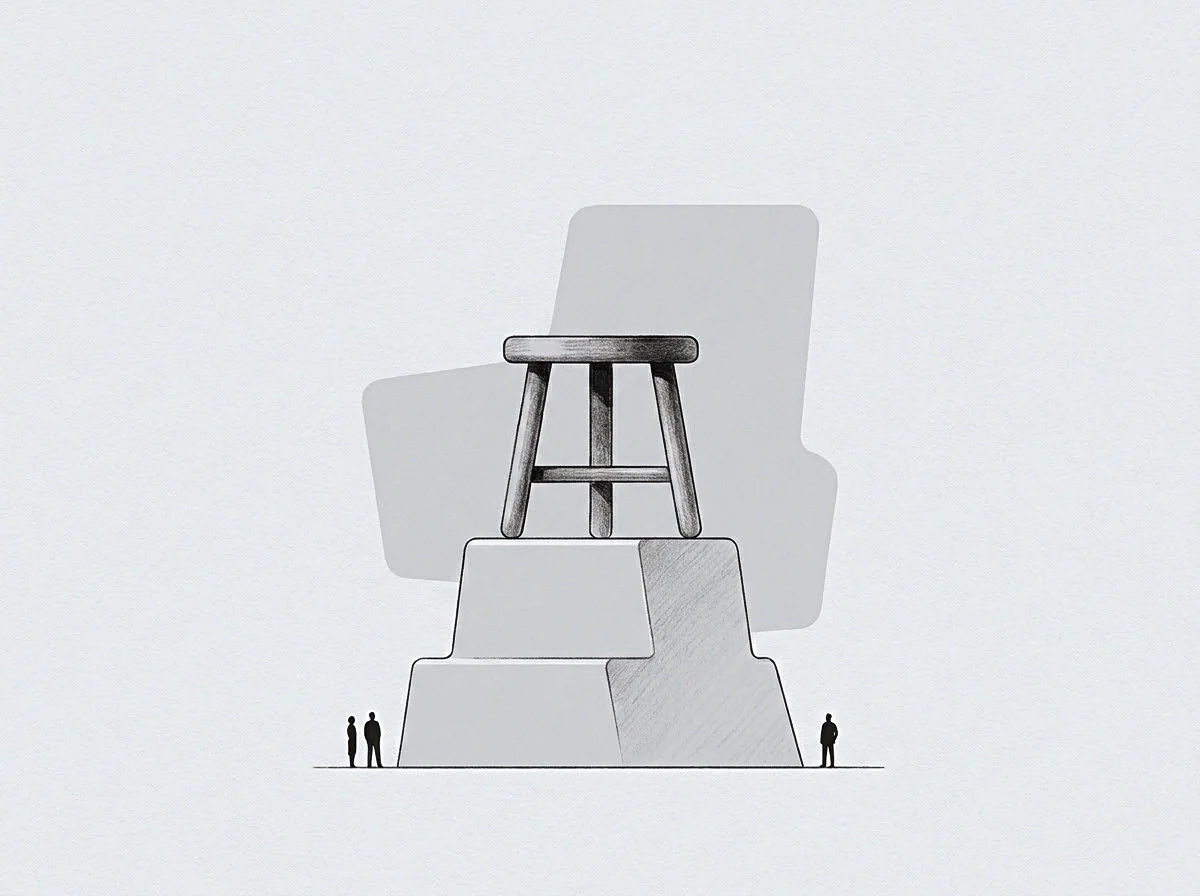
Seat
The position an operator occupies shapes their access to raw friction signals. Operational seats sit at distinct coordinates within the organizational architecture: an infrastructure lead observes system refractoriness through latency spikes and deployment failures, while a growth partner sees friction in contract negotiation delays and feature request backlogs. Each position generates a distinct perspective on system performance.
Consider two operational positions inside a software venture operating for three years. The growth seat tracks account expansions, while the engineering seat maintains platform stability. Standardized signals treat both seats as balanced contributors to target revenue, but spatial gradient analysis reveals that the growth seat operates along a declining gradient while the engineering seat absorbs rising structural friction to maintain baseline output.
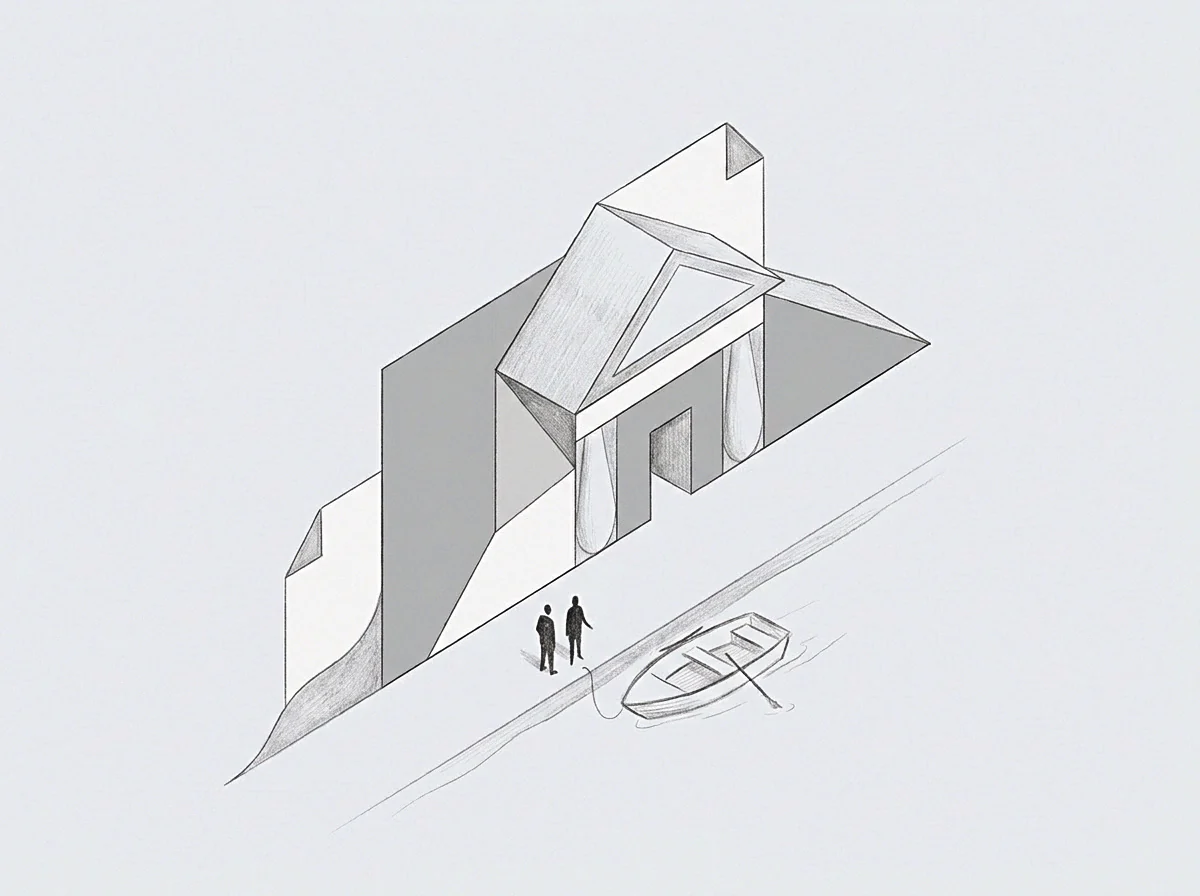
Mapping Friction Differentials Between Operational Roles
Different positions within an organization experience dissimilar resistance when executing standard procedures, meaning the seat itself dictates observed variance. Mapping these differentials requires comparing scalar inputs across organizational roles.
| Position Role | Primary Scalar Metric | Avoidance Vector Coordinate | Calculated Ascent Gradient |
|---|---|---|---|
| Infrastructure Lead | Deployment Frequency | Database Schema Refactoring | High Elevation Resistance |
| Growth Partner | Customer Acquisition Rate | Enterprise Contract Customization | Moderate Elevation Resistance |

Quantifying Structural Displacement Across Specialized Tasks
Measuring spatial variance in work execution compares expected labor throughput against actual duration. When an operator spends thirty hours resolving a task budgeted for five, structural displacement occurs, deflecting the operational vector away from planned development toward defect remediation.
This displacement registers as noise in standard reporting packages. In a vector field analysis, it reveals steep negative slopes along the underlying value axis, where the magnitude of displacement measures the cost incurred to maintain external scalar targets.
A department meeting spent reviewing aggregated target metrics obscures the specific task that three senior engineers avoided for a month.
The weekly dashboard met target numbers, yet the underlying system needed twice as long to deploy simple updates.

Displacement
Systemic resistance forces activity away from difficult operational terrain. Systems follow paths of least effort, drifting down steep gradients toward local minima. When an operational step requires high computational or emotional energy, human and software components route around the obstruction, leaving avoidance as a mark of unprocessed material.
Gradient descent describes this natural movement down the path of least resistance. Organizations default to familiar patterns because climbing an ascent gradient requires an active expenditure of capacity. As a result, the directional vector points downward toward immediate relief, even when overall structural health requires moving upward.
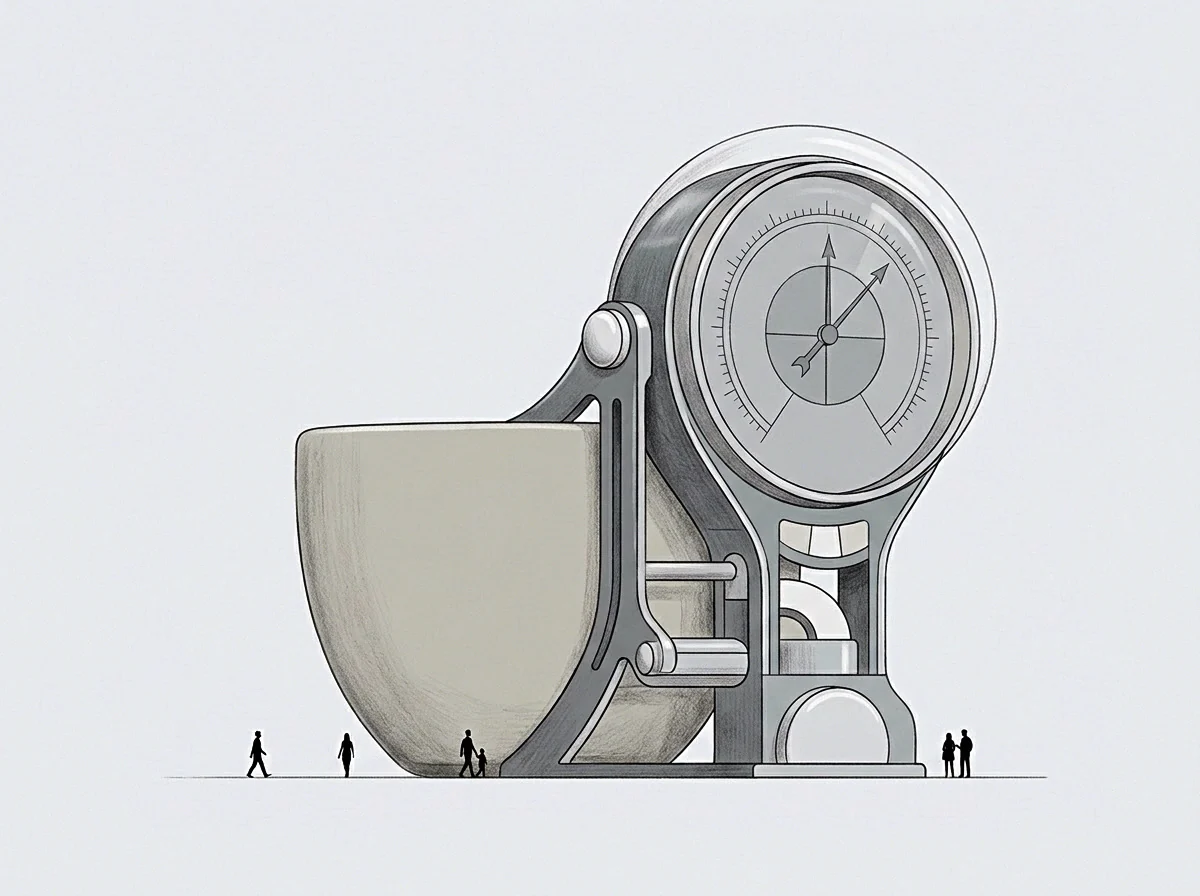
Identifying Refractoriness Markers in Standard Workflows
Unprocessed technical strain manifests as repeated delays around specific operational steps where routing follows the path of least resistance down the slope. Identifying these markers involves tracking where work halts, shifts owners, or undergoes scope reduction.
Operational refractoriness marks coordinates where the system refuses to execute planned commands. Its vector indicates strong negative slopes along the quality axis, pinpointing where structural debt has accumulated over prior execution cycles.
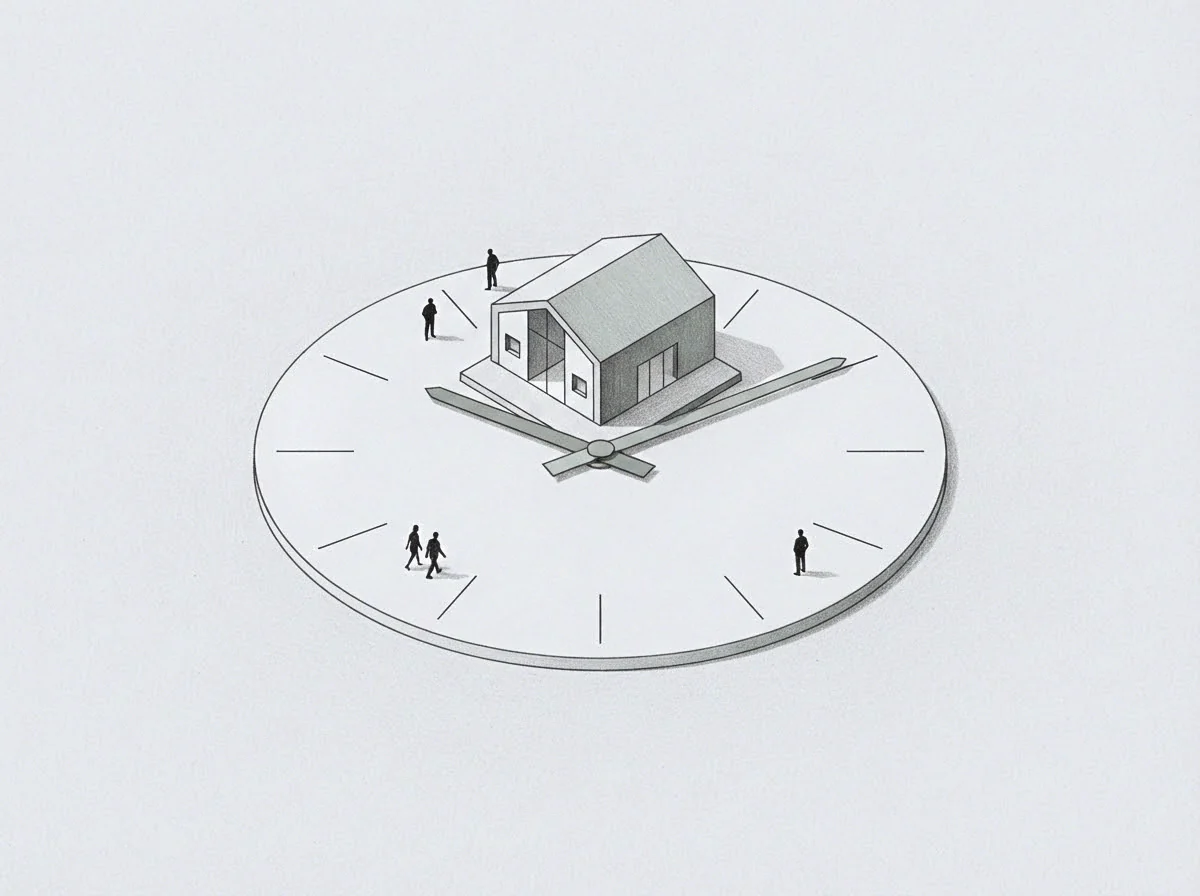
How Does Avoidance Reveal Unprocessed System Friction?
Routing work around a complex component creates an observable pattern of diverted capacity. When teams consistently decline to modify a core legacy service, the operational field shows zero vector throughput along that coordinate, forcing surrounding systems to absorb additional complexity to compensate for the untouched core.
- Refractoriness Latency measures the elapsed duration between task assignment and initial computational execution across complex codebases.
- Workaround Accumulation tracks the volume of auxiliary tools constructed to bypass legacy structural constraints.
- Boundary Deflection identifies the point where operational teams alter task scope to prevent hitting model limits.
Operational routing around a technical bottleneck expands the unspent system volume behind that bottleneck.
Ignoring operational refractoriness coordinates forces the enterprise to fund expensive workarounds while core infrastructure deteriorates.

Residue
Accumulated friction leaves quantifiable artifacts across operational logs. Routing around difficult terrain preserves short-term velocity while leaving unprocessed structural mass behind in backlogs, manual reconciliation steps, and unaddressed technical debt.
The gradient simply computes the slope of operational performance across defined parameters. Measuring latent potential requires mirroring the negative descent vector field above the operational baseline, which reveals the unspent capacity locked inside avoided tasks.
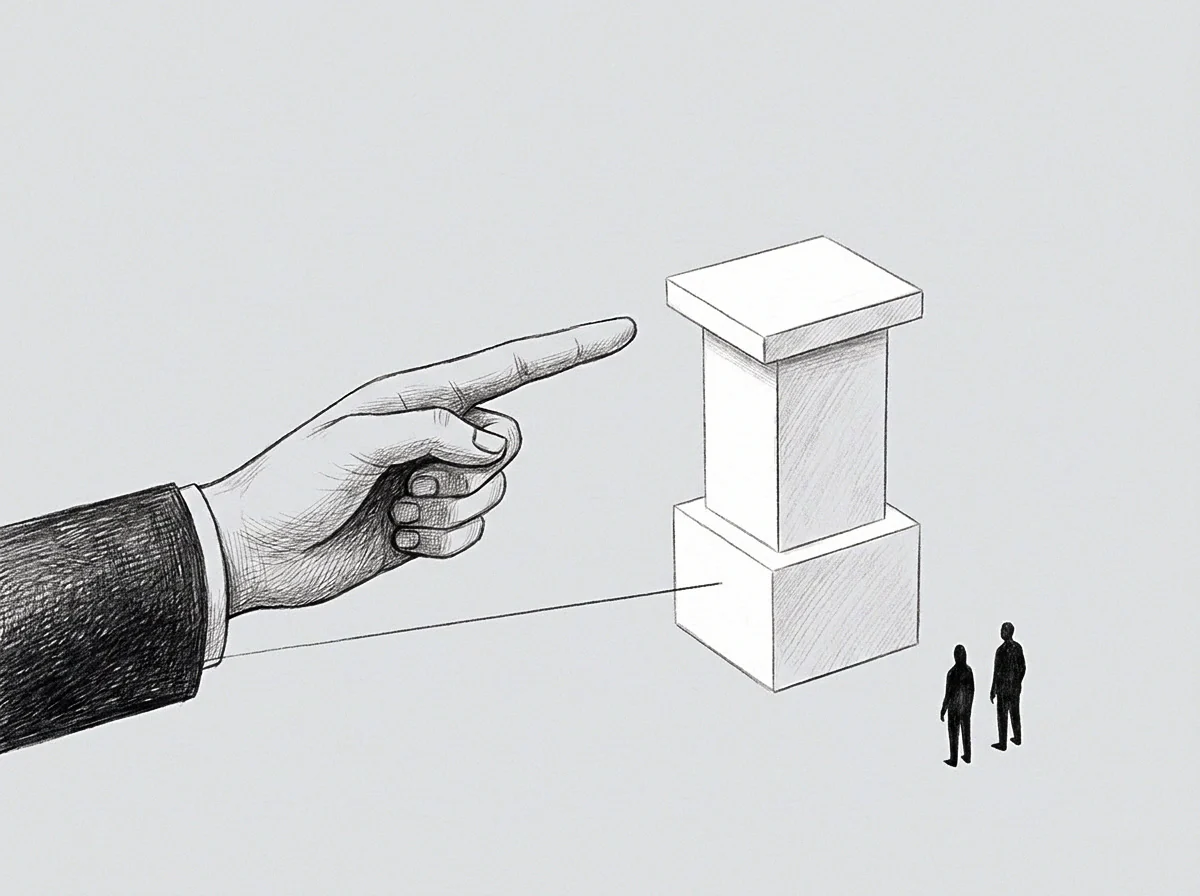
Mirroring Negative Slopes to Calculate Latent Potential
Inverting downward trajectories along an operational coordinate exposes the volume of capacity withheld from execution relative to the baseline reference point. When an avoided task generates fifty hours of indirect friction, mirroring that vector identifies fifty hours of recoverable operational throughput.
This quantitative mirror transforms passive delay tracking into active capacity forecasting. Because the volume contained above the baseline matches the magnitude of the negative gradient below it, resolving the root cause of the negative slope unlocks equivalent operational volume.
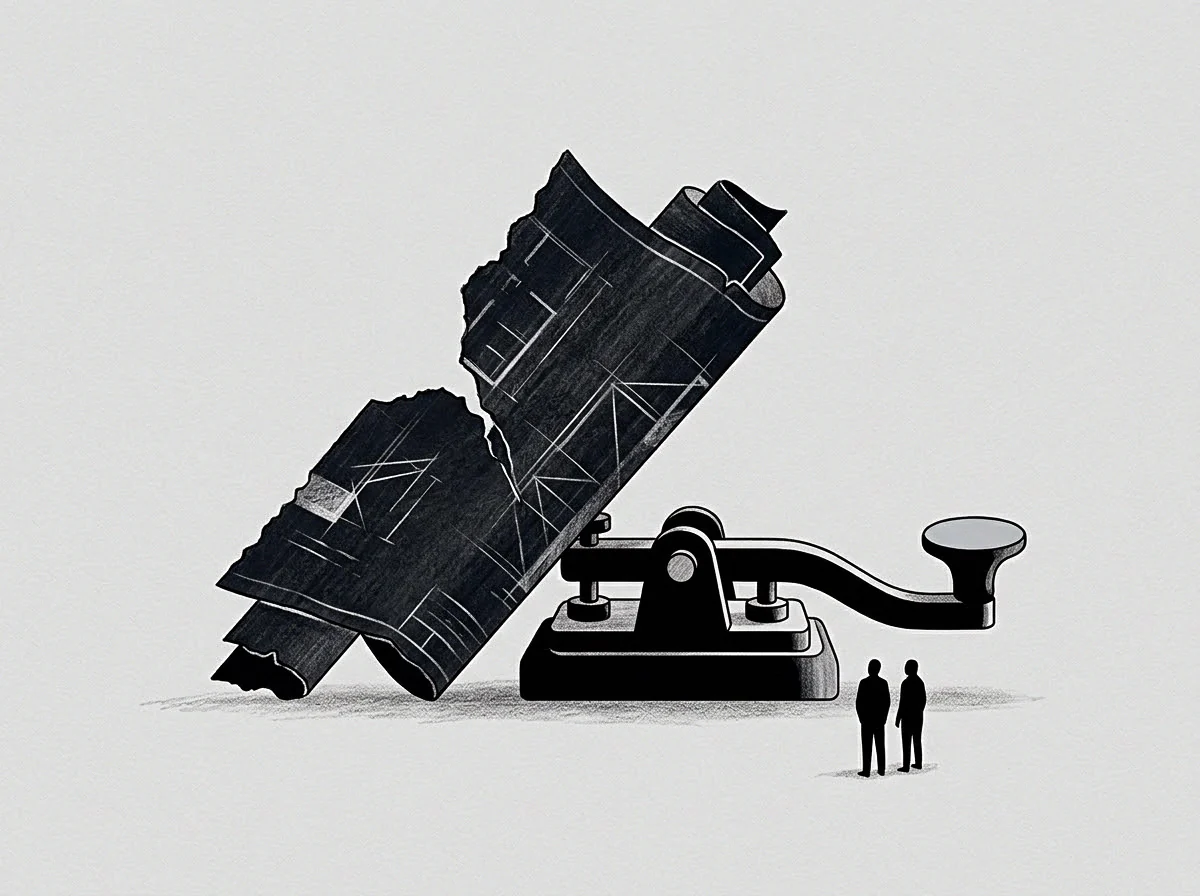
Establishing Baseline Operational Thresholds
A fixed reference line allows analysts to separate normal variance from structural decline. Standardized performance signals establish this baseline, and deviations from it define the continuous scalar field used to derive gradient vectors.
- First, the analyst establishes an operational baseline from historical throughput logs.
- Second, recorded delays are isolated as negative scalar vectors along the execution timeline.
- Third, the negative vector field is inverted vertically across the established baseline.
- Fourth, the area under the mirrored curve is integrated to measure total latent capacity.
Mirroring a negative slope across an established baseline turns recorded operational delay into a quantitative measure of latent capacity.
A declared baseline threshold transforms passive delay metrics into active measurements of unspent technical capacity.

Projection
Extrapolating vector fields into future cycles locates system constraints before performance collapses. Gradient vector fields project operational trajectories based on current directional derivatives; when vector slopes steepen toward negative infinity, system boundaries approach structural failure.
Operational models function efficiently within calibrated bounds up to the boundary wall. When external demands force execution past these limits, computational effort creates sharp discomfort, which acts as an instrument measuring the real-time processing cost of operating at the boundary wall.
Constructing Vector Trajectories Against Model Limits
Forward modeling maps continuous directional changes onto fixed operational boundaries where recorded errors supply the boundary coordinates. When an organization repeatedly encounters execution failures at a specific scale, those errors mark the geometric boundary of the current operational model.
Building effective models requires compiling boundary coordinates from recorded failures rather than optimistic targets. Gradient vector fields mapping these boundaries demonstrate where additional resources yield diminishing returns. When vectors align parallel to the wall, further ascent along that axis becomes structurally impossible without expanding the model itself.
The remaining question concerns how long an operational model can absorb vector deflection before structural failure forces an immediate refactoring.