
Calculating Capacity Vector Recovery Against Monthly Retainer Churn During Structural Client Boundary Restructuring
Boundary restructuring converts lost retainer revenue into reclaimed operational capacity vectors that expand net long-term margins when reallocated cleanly.

Drain
A service firm enforces strict delivery boundaries and response windows across its active accounts, causing two enterprise clients to terminate monthly retainers within thirty days. The sudden drop in cash flow appears as an immediate deficit on financial statement line items. Retainer churn carries an immediate price.
The financial loss dominates executive attention while the operational relief remains invisible in double-entry accounting records. Unmonitored scope creep, off-hours communication, and unbilled revisions consume substantial internal team capacity long before an account cancels.
When client scope boundaries tighten, low-margin retainers churn out of the organization. The exit of high-friction accounts halts an unpriced leak of labor hours and cognitive focus. Scope creep destroys operational capacity.
Calculating the true impact of retainer churn requires measuring both the lost cardinal revenue and the recovered capacity vector. Cardinal revenue consists of single financial figures. Operational capacity consists of a multi-component vector containing billable labor hours, executive attention, context-switching overhead, and technical capability.
Retainer churn creates an immediate reduction in cardinal cash flow while halting the steady erosion of unpriced operational hours.
Operators frequently panic during retainer churn events because monetary losses register instantly on account balances while capacity recovery accrues silently over subsequent billing cycles. The primary mechanism of boundary restructuring is the conversion of hidden operational labor into unencumbered internal bandwidth. When client communication channels clear, internal teams reclaim focus blocks previously spent resolving out-of-scope emergencies.
The baseline workload stabilizes, lowering team burnout metrics and restoring operational flexibility.
Failing to account for capacity recovery during boundary enforcement causes operators to panic, roll back scope limits, and reinstate client dynamics that consume double the capacity for half the effective yield.
Matrix
Evaluating retainer churn strictly through income statements distorts organizational decision-making. Cardinal financial metrics isolate revenue totals while ignoring the multidimensional expenditures needed to deliver service obligations. Cost operates as an ordinal vector across multiple operational dimensions.
A client paying ten thousand dollars per month while consuming three hundred staff hours creates a net drag on corporate resources compared to a client paying five thousand dollars for twenty staff hours.
Decomposing the Cardinal Price Against Ordinal Capacity Components
Decomposing an account requires separating the cardinal price from the underlying capacity vector. The capacity vector comprises four distinct operational components, each carrying its own magnitude and operational decay rate:
- Reclaimed Hours Vector measures the primary direct reduction in client-facing execution time following retainer departure.
- Attention Allocation Magnitude captures the decay in passive cognitive load once high-friction messaging channels close.
- Capability Growth Delta tracks internal hours diverted into non-billable asset development and operational workflow advancement.
- Context Switching Variance quantifies the reduction in daily task interruptions across cross-functional delivery teams.
Hours reclaimed equal bandwidth gained. Measuring these four components establishes whether a churned retainer released enough operational capacity to justify the loss of recurring revenue. In high-friction client arrangements, the internal cost vector continuously exceeds the cardinal price paid by the customer.
When structural boundaries eliminate low-margin client friction, reclaimed cognitive bandwidth expands the baseline throughput of remaining operational lines.
Calculating the Vector Recovery Ratio
Calculating vector recovery involves benchmarking team utilization metrics before and after client boundary restructuring. The baseline measurement window tracks time expenditures across ninety days preceding contract termination. The recovery calculation compares lost retainer revenue against the total hours reclaimed multiplied by the baseline internal execution expense.
Attention remains a finite vector. When reclaimed capacity allows remaining accounts to receive higher service precision, account retention across compliant clients improves, offsetting initial retainer churn.
The vector recovery index establishes the exact point where lost retainer revenue equals the net value of unencumbered internal focus.
Desk
Reclaimed operational capacity does not automatically convert into expanded profit margins or higher organizational capability. When client retainers churn, freed staff hours often dissolve into disorganized internal administrative tasks or unbilled slack time. The operational desk serves as the allocation point where recovered vectors turn into measurable organizational assets.

When Does Reclaimed Vector Capacity Convert to Margin?
Capacity recovery generates economic value only when leadership explicitly directs reclaimed staff hours toward strategic targets. The cardinal balance drops instantly. Without clear operational allocation protocols, teams absorb recovered bandwidth through extended meeting durations and lowered output urgency.
Reallocation determines net structural efficiency. Operational leadership directs recovered hours into three designated destination vectors:
- Audit active client hours across a trailing ninety-day baseline to isolate off-scope friction points.
- Draft revised boundary agreements specifying strict delivery windows and clear revision limits.
- Reallocate freed hours directly into internal asset construction or higher-tier client acquisition pipelines before churn materializes.
Enforcing explicit scope boundaries without a pre-allocated capacity deployment plan converts billable churn into internal organizational drift.
Operational Reallocation of Recovered Hours
Assigning recovered capacity to internal tool construction raises the technical capability floor of the firm. High friction consumes core team focus. Unpriced communication drains operational focus.
When senior engineers or strategists cease fire-fighting out-of-scope requests, they build automated templates, refine delivery pipelines, and design proprietary service assets. These internal improvements lower the delivery cost for remaining clients, permanently expanding net operating margins.
The updated service terms exceed the operational footprint agreed upon during initial onboarding, so the contract will terminate at the conclusion of the current billing cycle.

Friction
Boundary restructuring creates predictable client friction during contract renegotiation phases. Accounts accustomed to informal service delivery, unlimited revisions, and immediate response windows frequently resist formalized scope boundaries. When presented with updated terms, client behavior branches into acceptance, structural negotiation, or immediate retainer cancellation.
Structural Boundary Reset Mechanics and Client Pushback
Client resistance stems from the perceived loss of operational leverage. In informal agency arrangements, clients extract extra-contractual labor without incurring financial surcharges. Scope limits protect long term yield.
Introducing formalized response windows, explicit revision caps, and strict deliverable definitions forces clients to internalize their own management inefficiency. Clients unable or unwilling to operate within clear operational boundaries choose retainer termination.
| Account Category | Cardinal Revenue Share | Ordinal Capacity Vector Drain | Post-Restructuring Churn Risk | Net Vector Recovery Potential |
|---|---|---|---|---|
| High-Friction Legacy Account | Thirty-Five Percent | Sixty-Two Percent | High Churn Probability | Maximum Capacity Release |
| Standard Boundary Account | Forty-Five Percent | Twenty-Eight Percent | Moderate Restructure | Low Capacity Disturbance |
| Tiered Enterprise Model | Twenty Percent | Ten Percent | Low Churn Probability | Neutral Bandwidth Impact |
The table illustrates how high-friction accounts disproportionately consume operational capacity vectors while delivering sub-optimal margin relative to their cardinal revenue contribution. Removing a single high-friction legacy account releases sixty-two percent of internal bandwidth while reducing top-line revenue by thirty-five percent. The resulting operational capacity enables the business to scale remaining accounts without expanding staff headcount.
Capacity reclaimed from high-friction clients yields higher long-term operating margin than equivalent capacity sold under unmonitored scope boundaries.
Worked Scenario of Retainer Churn and Reallocated Bandwidth
Take a professional services firm operating four monthly retainers at ten thousand dollars each, yielding forty thousand dollars in monthly recurring revenue. Assume two accounts consume seventy percent of total engineering delivery capacity due to undocumented revision cycles and off-hours communication requests. The leadership team introduces standardized client boundary agreements, capping monthly communication hours and establishing strict revision windows.
One high-friction client refuses the new boundary terms and cancels their ten thousand dollar monthly retainer immediately. Top-line monthly revenue drops to thirty thousand dollars, creating an apparent twenty-five percent revenue loss. The delivery team reclaims thirty-five percent of total operational hours previously lost to scope creep.
Capacity vectors move along ordinal scales. The operator reallocates these reclaimed hours into building automated delivery infrastructure for the remaining three clients.
Within sixty days, internal delivery costs for remaining accounts drop by forty percent due to the newly constructed infrastructure. The firm then onboard one new client under strict boundary terms at twelve thousand dollars per month. Total monthly revenue reaches forty-two thousand dollars, delivered with twenty percent less overall team fatigue than the initial baseline.
The temporary retainer churn served as a necessary catalyst for structural margin expansion.
Whether senior team members can consistently resist the temptation to fill newly opened capacity with loose, unbordered client work remains an open operational dilemma.
Vault
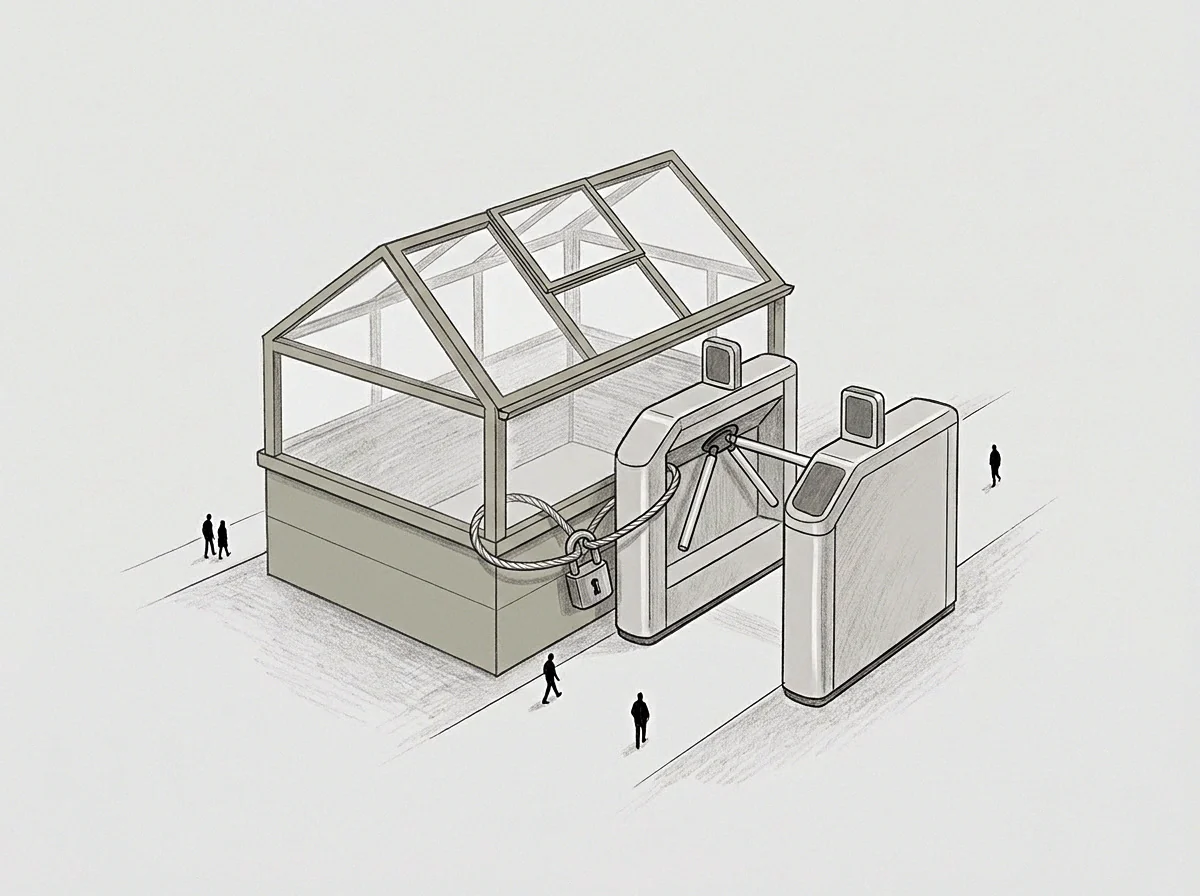
Long-term organizational stability depends on preserving the operational margin floor established through client boundary restructuring. Without continuous boundary monitoring, service firms suffer from gradual scope erosion as sales teams grant concessions to secure new accounts. The margin floor remains intact.
Protecting capacity vectors requires embedding boundary enforcement directly into operational management systems.
Securing the Capability Floor Against Future Boundary Decay
Preventing scope boundaries from eroding requires establishing fixed operational capacity budgets alongside financial accounting systems. When a new retainer enters the firm, project managers assign strict hour ceilings and communication allocations matching the contract tier. If client demands breach agreed limits, automated notification protocols trigger scope adjustments or mandatory contract amendments before capacity depletion occurs.
A smaller portfolio of strictly bordered clients produces higher structural margin and greater operational resilience than a sprawling revenue base burdened by perpetual boundary leakage.