
Measuring Unseen Capacity Drain Across Core Operational Systems
Operational capacity drains through systemic work routing around friction points where execution costs exceed the setpoint of the core model.

Baseline
Core operational throughput relies on measured output levels across standard execution windows. An engineering team can run a high-throughput processing pipeline at full headcount for twelve months while daily completion volume drops by forty percent. Financial monitoring shows stable infrastructure costs and complete salary utilization, masking the fact that processing capacity is leaking into informal workarounds.
Engineers sit through required status updates while manual data transfers swallow half of every afternoon. Centralized dashboards record operational health by tracking system uptime instead of active processing efficiency, leaving the capacity drain invisible because standard reporting measures asset presence over computational yield.
Operational Throughput Metrics
Standard engineering monitors evaluate primary execution tracks to establish expected performance bands. Primary tracking metrics capture surface completion events but miss the secondary effort required to force those events through degraded pathways. When a database query slows from fifty milliseconds to four seconds, operators do not stop working; they build local caching mechanisms, copy raw payloads into temporary spreadsheets, and reconcile discrepancies during off-peak hours.
System capacity leaks directly into these unmonitored recovery loops. The setpoint defines the operational limit. Allostatic load findings in operational stress physiology demonstrate that human operators absorb systemic degradation through heightened physiological effort, resting on neuroendocrine marker studies across shift-work populations.
This finding would be revised if continuous non-invasive cortisol tracking proved autonomous recovery occurred during active task switching.
Every operational system runs along an axis of value where raw inputs convert into finished outputs. When friction develops along primary execution paths, the calculated gradient shifts downward, reflecting an increasing energy requirement for identical output levels. Measuring this slope requires tracking the delta between expected resource consumption and actual human effort expended.
Traditional accounting systems log software license fees and hardware server costs as fixed cardinal figures, failing to capture the ordinal cost of operator fatigue, delayed execution cycles, and defensive scheduling strategies. Capacity drains silently through unmonitored bypasses.
A core operational system routes work around known execution obstacles whenever local processing costs exceed standard thresholds.
Calculated System Capacity Limits
System design specifications outline maximum theoretical payload constraints during continuous processing cycles. Standard baselines assume clean execution environments where task requests move directly through automated pipelines. In practice, real execution environments accumulate structural debris over time—unmaintained dependencies, legacy API adapters, and undocumented compliance checks.
Work moves along paths of minimal effort. The delta between theoretical system capacity and observed throughput represents the baseline drain coefficient, permanently altering the operational baseline until structural debt is cleared.
Gate
Execution pathways encounter structural checkpoints where active task payloads pause for verification. When an operational node introduces unexpected validation requirements, processing pipelines split into primary and secondary channels. Primary channels hold formal task traffic, while secondary channels carry informal traffic modified by staff to bypass regulatory delays.
These secondary pathways form an unmonitored network within core infrastructure, absorbing processing power that never registers on central management dashboards. The setpoint determines where capacity turns into friction. The core model accepts minor variance.
Work Routing Diversion Points
Unprocessed payloads alter their course when meeting unexpected processing resistance. Staff members identify rigid structural controls that slow execution, developing custom scripts and off-platform communication chains to maintain delivery schedules. This manual routing preserves short-term velocity at the expense of long-term operational visibility.
The system routes around these friction coordinates, creating dense clusters of informal activity around every strict verification node. Over six months, an operational unit can spend up to thirty percent of its total compute hours maintaining these informal bypasses.
Analyzing system architecture requires comparing formal execution paths against informal bypass channels across core operational metrics. The operational variance becomes clear when evaluating resource allocation, latency profiles, and failure visibility across both mechanisms.
| Operational Metric | Primary Execution Path | Secondary Routing Channel |
|---|---|---|
| Throughput Latency | Predictable baseline timing with fixed queuing delays | Variable execution speeds dependent on manual intervention |
| Compute Overhead | Standardized server utilization tracked via central logs | Distributed endpoint processing hidden from core telemetries |
| Error Observability | Automated logging with immediate exception alerting | Unrecorded failure modes resolved through informal messaging |
| Cost Allocation | Direct cardinal billing linked to specific business units | Unassigned operational cost absorbed through operator hours |

Systemic Bottleneck Vectors
Operational flow collapses into queue delays whenever concurrent demands exceed local bandwidth. A single verification checkpoint requiring manual authorization creates an operational wall where task execution halts. To avoid project stalls, teams pre-authorize batches of incomplete tasks, pushing unverified payloads downstream where errors multiply.
Errors mark the active system boundary. Systemic cost accumulates without explicit logging.
Staff members adapt to systemic drag by expanding local buffers and extending delivery windows, attributing delays to external system dependencies that require extra processing time to complete routine operations.

Friction
Systemic resistance accumulates within daily operations through unspoken workarounds and informal task modifications. Take two operational units processing high-frequency data integrations over eighteen months. Unit A adheres strictly to formal platform protocols, accepting task delays whenever integration endpoints fail.
Unit B builds local transformation scripts, bypassing validation layers to maintain scheduled output targets. Financial statements show Unit B outperforming Unit A in immediate project delivery, yet operational audits reveal Unit B spent forty percent of its engineering budget fixing corrupt database entries generated by unvalidated scripts.
Unspoken operational workarounds reveal the precise boundaries where formal architecture fails to accommodate live throughput demands.

Could Latent System Drag Reveal Real Operational Capacity?
Unmonitored effort spent bypassing rigid operational workflows often matches the total missing output of a struggling division. When engineers spend twenty hours each week translating data formats between incompatible software suites, that capacity vanishes from core feature development. This loss acts as a hidden tax on organizational output.
Reference-class forecasting models in behavioral decision science demonstrate that team leads consistently underestimate execution friction by fifty percent, relying on historical project completion distributions across enterprise infrastructure. This finding shifts if real-time algorithmic telemetry eliminates human bias in task variance estimations.
Measuring this hidden friction requires mapping the path tasks take against the path designed in core system documentation. The coordinate distance between these two paths marks the exact magnitude of operational bypass. Where that distance is wide, employees spend substantial cognitive energy managing process exceptions rather than executing primary tasks.
The magnitude of avoidance reflects the scale of structural debt sitting behind the process. A system cannot resolve what it cannot trace.
The relative magnitude of systemic resistance identifies operational bottlenecks long before financial ledgers reflect monetary loss.

Ordinal Drag Vectors Against Cardinal Accounting
Financial ledgers record explicit invoice amounts while ignoring the relative resistance engineers experience when handling legacy infrastructure. A ten-thousand-dollar software license appears as a minor expenditure on an income statement. If that software requires three manual configuration steps for every processing run, the operational cost vector points sharply upward.
The true expense sits in the ordinal rank of operator frustration and execution delays, metrics standard double-entry bookkeeping ignores entirely.
Systemic capacity drains through these unmonitored resistance loops, leaving teams exhausted without clear evidence of product movement.
- Manual data reconciliation creates persistent background overhead that operators absorb to maintain daily report accuracy.
- Informal approval loops lengthen task completion windows as staff seek consensus before committing compute resources.
- Legacy interface workarounds force engineers to construct local automation scripts to bypass broken primary pipelines.
- Shadow task prioritization shifts focus toward visible low-complexity deliverables while severe systemic debt compounds.
Ignoring informal workarounds leads directly to catastrophic execution failure when scaled transaction volumes collapse fragile manual bypasses.
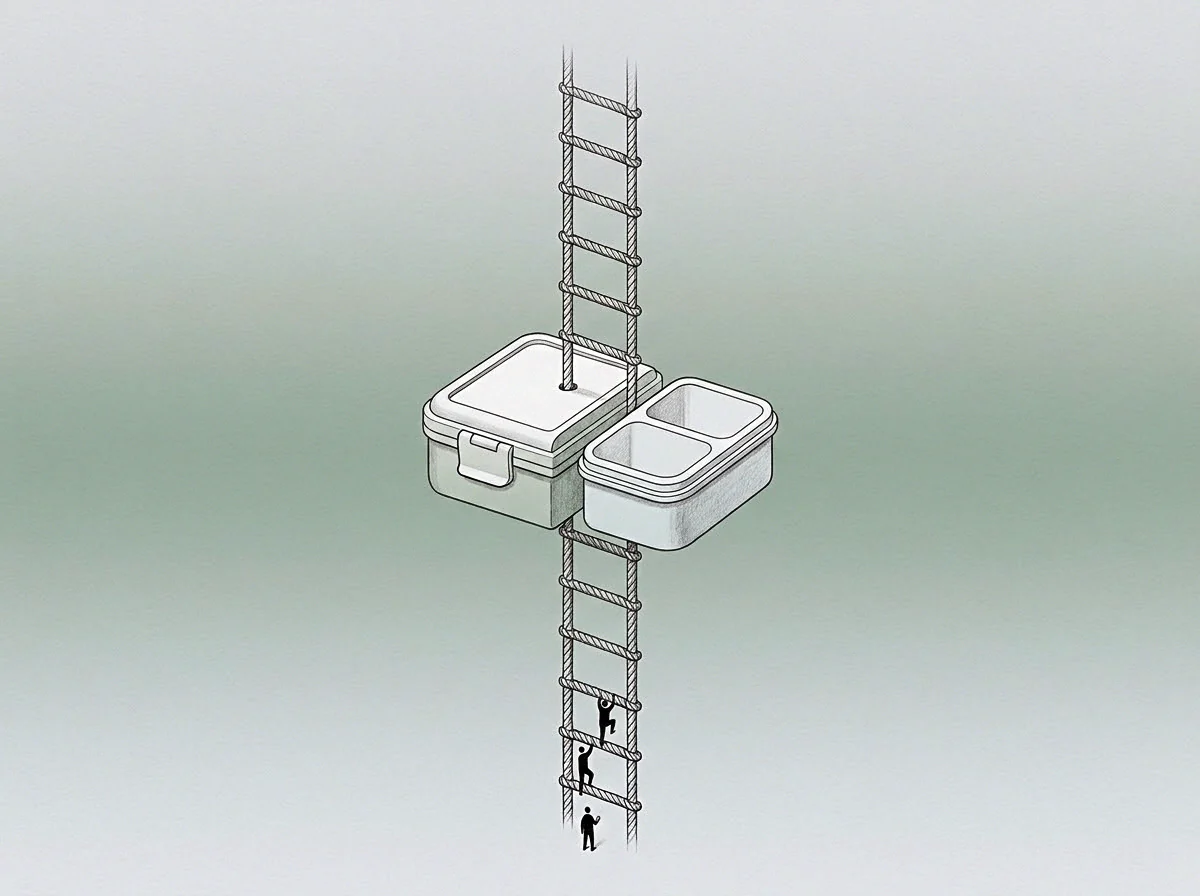
Descent
Work naturally slides toward tasks requiring minimal cognitive or technical effort. When an operational pipeline presents steep friction, human behavior routes task flows down the path of least resistance. This descent operates as an automatic optimization mechanism, minimizing immediate energy expenditure while diverting work away from core architectural objectives.
The path of least resistance reveals where system design conflicts with daily operational realities.

The Mathematical Vector Of Least Resistance
Optimization models predict that complex task graphs resolve along paths that minimize immediate resource consumption. When primary validation channels require six steps and secondary manual channels require two, execution shifts entirely to secondary channels. This mathematical reality governs operational behavior regardless of corporate policies or formal training manuals.
The vector of descent points away from high-friction computation nodes toward low-friction temporary solutions. Gradient descent describes how systems settle into local efficiency minima while abandoning global operational throughput.
- Operational teams observe increasing processing latency across primary transaction channels during peak execution windows.
- Staff construct secondary manual routing pathways to bypass throttled system components and meet immediate SLA requirements.
- Secondary channels operate without formal logging metrics, hiding the true computation cost from centralized monitoring dashboards.
- The core model stabilizes around degraded performance baselines while actual capacity drains into unmonitored operational overhead.
A fixed performance threshold without adjusted system capacity diverts task execution into secondary unmonitored channels.
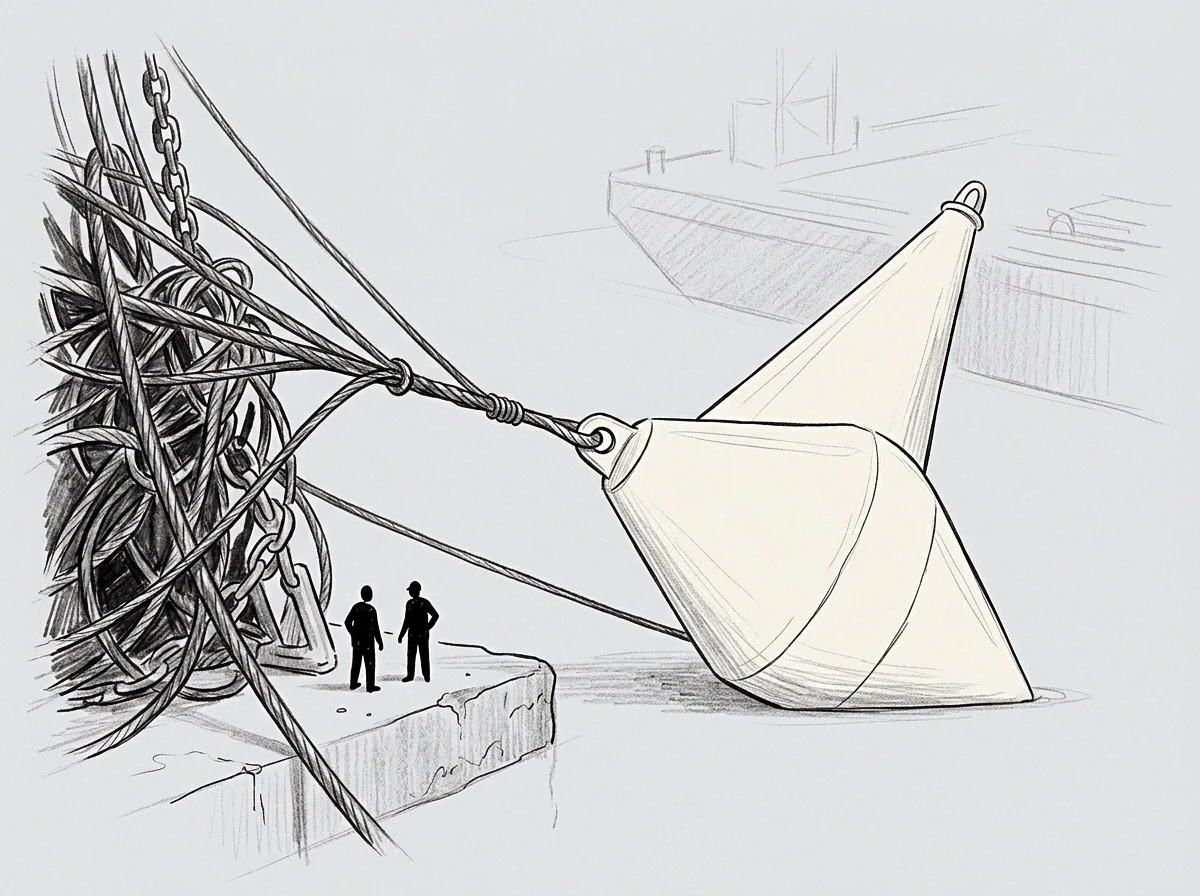
Accumulated Routing Cost Equations
Summing total operational expenditures requires tracking both direct execution fees and hidden secondary bypass delays. The accumulated cost equation adds explicit server fees to the latent hours spent by personnel managing process breakdowns. As secondary routing expands, the system converges toward a state where eighty percent of total operational capacity maintains bypass structures, leaving twenty percent for primary payload processing.
Execution stops where compute costs escalate.
How long can an enterprise maintain core throughput when secondary execution pathways absorb the majority of daily operational compute capacity?
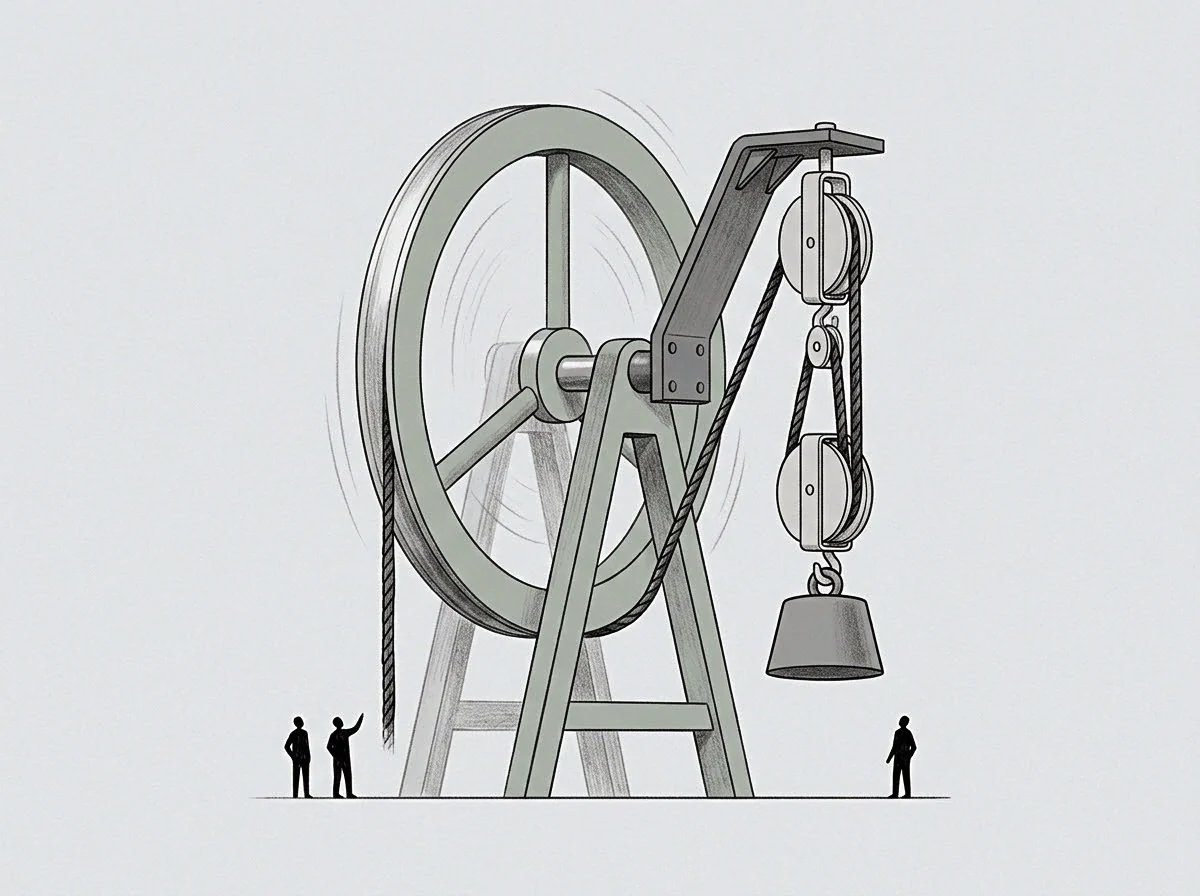
Volume
Unspent processing energy remains stored within structural workarounds until systematic measurements bring it to light. Mirroring the negative operational gradient above the baseline reveals the unspent potential volume locked inside degraded workflows. This potential represents productive output that becomes available the moment structural walls are removed from core execution paths.
The magnitude of this latent volume matches the exact volume of energy currently wasted on process avoidance.

Mirrored Potential Above Systemic Baselines
Inverting the measured curve of operational avoidance projects the exact magnitude of available execution reserves. When an operational unit spends forty percent of its time routing around broken data pipelines, fixing those pipelines instantly releases that forty percent back into productive capacity. The latent volume is not a hypothetical figure; it is an unspent physical resource currently consumed by systemic friction.
The exact ratio at which unspent operational potential converts into recoverable execution throughput when a wall is removed remains mathematically unproven across complex enterprise architectures. An operator under this uncertainty establishes a conservative fifteen percent recovery window while monitoring local friction vectors.

Boundary Coordinates Of Systemic Capability
System execution halts at exact structural limits where computational demands exceed existing architectural capacity. These boundary coordinates define the wall of the current operational model. The wall consists of processes the enterprise refuses to compute formally because execution is deemed too expensive or complex.
Pushing against these boundary coordinates creates immediate operational discomfort, signaling that active computation rather than passive retrieval is occurring. Transforming failure coordinates into precise system requirements expands the model boundary, converting latent capacity drain into verifiable throughput output.
System capacity recovers in direct proportion to the structural friction removed from primary execution pathways.